The linked post is pretty heavy stuff, but at least look at the first couple paragraphs before Sam Wang gets all mathy with it. He also does a good job of explaining why PEC is different, by design, from 538—that the goals are different, and perhaps the motivations as well. I think it’s all done quite politely and without completely trolling N*te Silv*r other than to point out how badly wrong S*lv*r got the PEC methodology when he tried to explain what was wrong with it two years ago, which is what will happen when you don’t really get math and someone’s doing math. One thing Dr. Wang is not shy about is telling people that their reasoning is bad, when he can prove that it is. So here’s the beginning, and we can move on a bit from there or not as you please.
“Three sets of data point in the same direction:
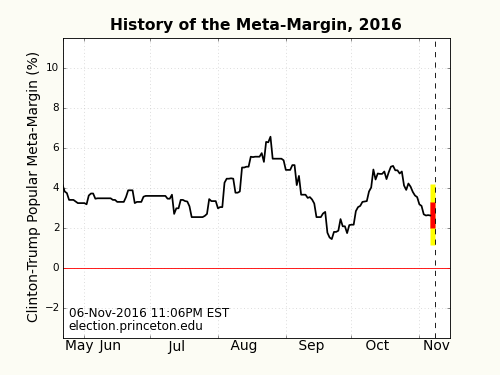
- The state poll-based Meta-Margin is Clinton +2.6%.
- National polls give a median of Clinton +3.0 +/- 0.9% (10 polls with a start date of November 1st or later).
- Early voting patterns approximately match 2012, a year when the popular vote was Obama +3.9%.
Based on this evidence, if Hillary Clinton does not win on Tuesday it will be a giant surprise.”
Not that giant surprises never happen, but it’s pretty important that they should be understood as giant surprises before they do, if at all possible.

Anyway, here we have a long but extremely explicit analysis of PEC’s own methodology, and how Dr. Wang creates his meta-margin (currently 2.5% as of 10:06am today), defined as the amount in which the aggregate result would have to change in order for the race to become a toss-up, including cross-referencing it against Senate polls, as the correlation between presidential and down-ballot results is exceptionally strong.
If you’ve been following the PEC graph for a while, you’ll notice that at Election Day, now only one day in the future, there have always been two bars, a red and a broader yellow, showing the margin of error at one and two standard deviations—of course, as you approach the event date and the win probability for one candidate grows, those bars get narrower and narrower, so that even the yellow, at 2SD is now above the break-even line by over 1%.

Looking at the chart, Wang points out that
“this variation over time automatically tells us the effects of correlated error among all states. Uncorrelated error is cancelled by aggregation under the assumption of independence; what is left is correlated variation. The problem is solved without any regression. Hooray!”
Well, OK. This is a bit of a swipe at N*** Sil*er, who not 1) relies more on national polls than state, adding rather than subtracting uncertainty, 2) double-counts old national polls by using them to adjust current ones, and 3) adds a variety of double-secret parameters and then runs regressions to fit a line to the massaged data. That’s pretty subjective math, if math it be.

What’s interesting is that Dr. Wang does admit that he could have used slightly more conservative parameters, but even (stats nerd alert) dropping from three degrees of freedom to one would only take the win probability down to 91% from the current 99%+; to his credit, he says that in retrospect he would have created the model in such a way that it would look more like 95% now, but that it’s too close to the wire to make adjustments, which is of course another way he differentiates himself from Nat* Si****, who will be adjusting his model until the day after Election Day where it will backtest perfectly.
Wang also points out, with some justification in my mind for what that’s worth, that there’s really not a lot of difference at this point between 93% and 99% so close to the event you’re trying to forecast.
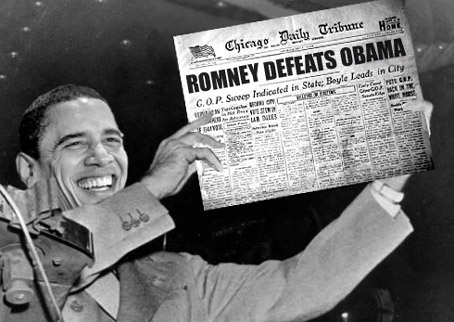
While past performance is no guarantee of future etc, I’d also point out that the last few elections the poll aggregation has, because it has been conservative rather than skewed, underestimated the margin of the winning party. The day before Election Day in 2012, the Obama meta-margin was 2.3. He won by 4, and the Romney people were convinced their guy had it in the bag, even after Fox News had called it for the president.

http://election.princeton.edu/2016/11/06/is-99-a-reasonable-probability/
Post A Reply